Introduction to monitoring and New Relic

Why is it important to monitor a website?
When developing web projects of a certain size, it is usually critical that these portals are up and bug-free for as long as possible. This is where website monitoring comes in.
Monitoring a website allows us to know information about it in real time (metrics such as: average load time, execution time of each database query, browser and versions,...). It also allows us to configure warnings/alarms to detect critical moments as soon as possible and take quick actions.
Having all this information in a visual way and the possibility of filtering the graphs of these metrics with a lot of granularity is a wonderful tool to make better decisions for any type of optimisation on the site.

Monitoring a web portal is normally a task associated with devops or IT teams, but it can be really useful for developers as well.
We are not only talking about high availability of the website. Having as much information as possible about a web portal is crucial to take actions to optimise the performance of a web page. For example, knowing when there are load peaks, or identifying which function of the code takes the longest to execute greatly facilitates the developer's subsequent work.
New Relic
Although there are many other tools (APM - Application Performance Monitoring) to know in real time the metrics of a site, we would like to highlight New Relic as we have more experience with it.
New Relic offers us an endless amount of useful information about our site, and with a low complexity in terms of installation of this monitoring tool. Moreover, its integration with Drupal allows us to get more out of the tool, being able to filter the information to obtain very specific data. For example, knowing the average execution time of each function would help us to detect a bottleneck in terms of web performance.
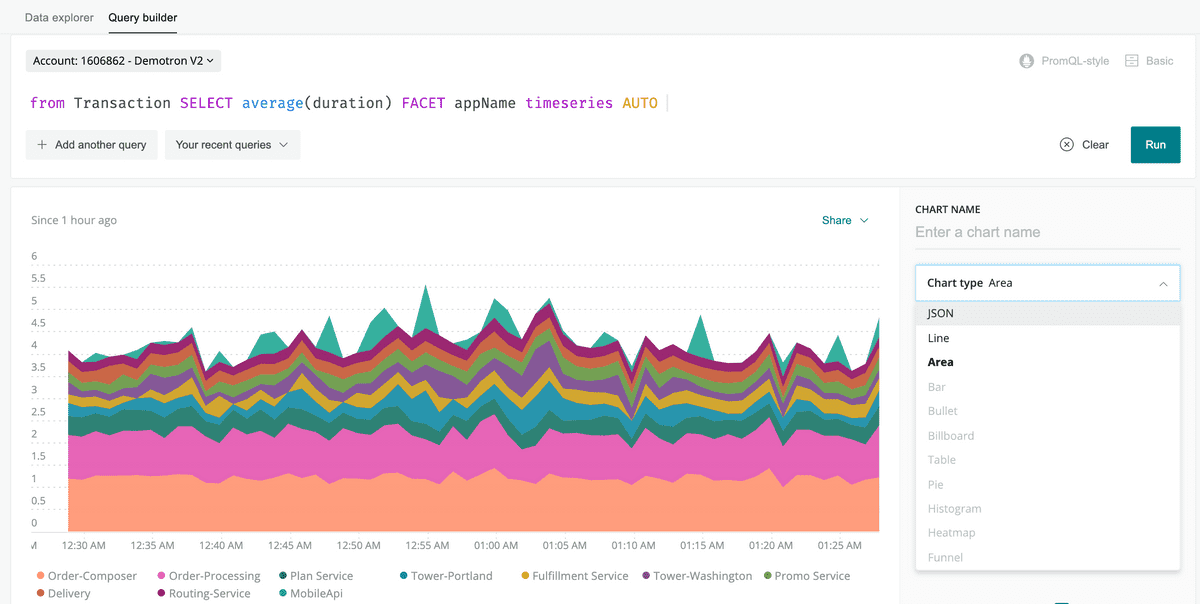
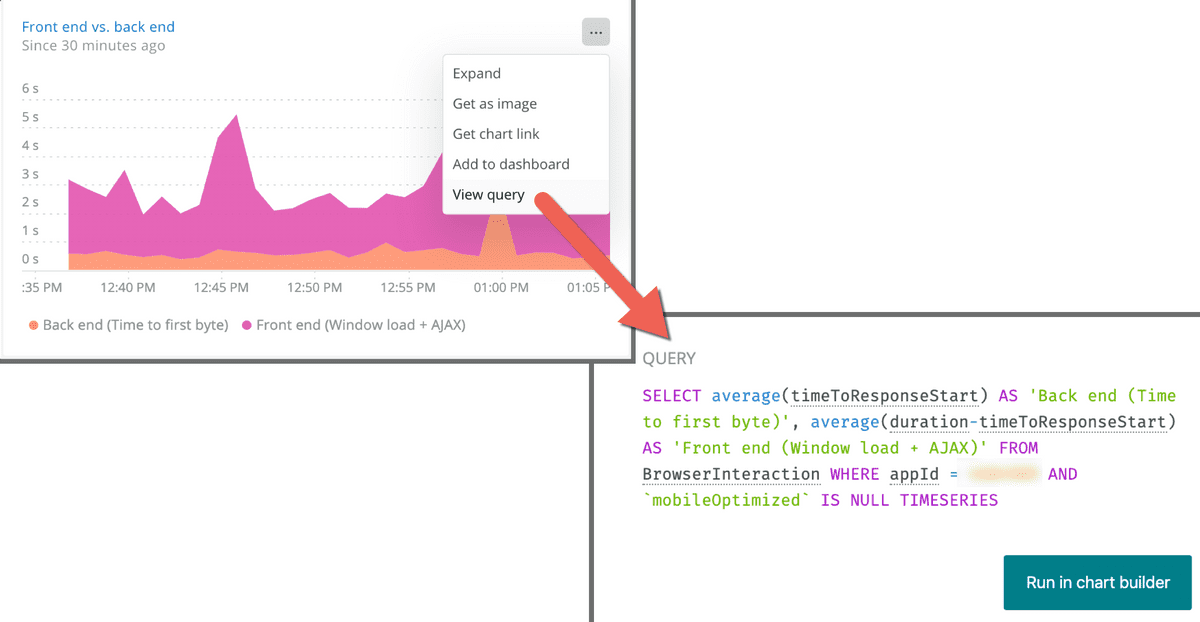
New Relic has its own markup language, NRQL (New Relic Query Language), to help locate the information we need in the maelstrom of data. Its syntax is similar to other query-oriented languages, such as SQL.

Although NRQL can help us to configure a specific graph, for more basic information it is not even necessary, as the interface itself helps us to apply filters to get to the data we want.
Another interesting function provided by New Relic is error reporting. With it we can locate both server (PHP, in the case of Drupal) and client (JS) errors. This is extremely useful for the refinement of these errors, as it helps to know the context of the error (when it occurred and making what request).
Fuentes


